Reporting Services: Creating a Index / Table of Contents with Hyperlink Shortcuts
If your report is very large and the data is grouped into different sections, you might want to think about making it easier for your users to navigate around. You can do this by providing bookmarks in your report, and a table of contents, or index, at the top which they can use to jump to specific sections of the report.
Setting Up
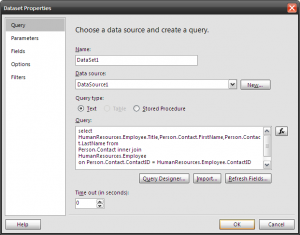
I’m going to use the Adventure Works database to get some names and departments. I’m using the following SQL to pull out some random data about people and the job titles they have:
</code><code>
select HumanResources.Employee.Title,Person.Contact.FirstName,
Person.Contact.LastName from
Person.Contact inner join
HumanResources.Employee
on Person.Contact.ContactID = HumanResources.Employee.ContactID
order by HumanResources.Employee.Title<code>
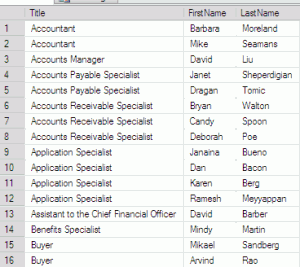
Here’s a sample of the data:
In Reporting Services 2008, create a new report, but don’t use the wizard, instead choose to “Add an item” and select “Report”. Add whatever Data Sources you need to connect to your database and then add a dataset. For the purposes of this post, I’ll be adding the SQL text directly into the report: you should consider using a stored procedure for production reports, as it keep everything neater and allows more reuse.
Now, from the toolbox, drag in a Table. If you only have one dataset, it will be automatically chosen as the dataset for the Table, otherwise set it in the Properties. Click the blue table icon which appears as you hover over each field to add each of the three fields in. Your table should look like this:
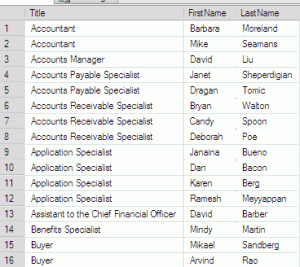
Before we do anything else, let’s check everything has worked up to now, by Previewing the data:
Group the Data
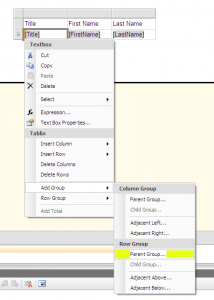
For the purposes of this exercise, I’m going to group by title – because I want to be able to jump directly to specific titles . Right click the Title field to bring up the context menu. Choose to add a parent row group. (this is different to a column group – which you could also do, but will have different results. I’ve highlighted the correct Parent Group in the screenshot below:
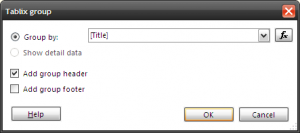
From the dialog box, select the title as the row to group by, and specify that you want a group header:
This will add a new column to hold the Title, and group the details by the Title. The table should look like this:
This need some tidying up – we have Title twice now. We no longer need our original Title (if you Preview now you’ll see that it will be repeated for every row which is pretty pointless), so we can delete it. I’m also going to rename the “Group1” title back to Title:
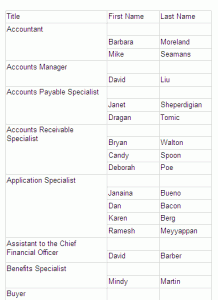
 Now that I’ve done this, let’s Preview the data and see how it looks:
Create a TOC
So now I have my data looking how I want it, what about a Table of Contents. I’m going to create another Dataset, this time with just the Title in it, following the same process. To select all titles, I’m using the following SQL:
SELECT DISTINCT title
FROM humanresources.employee
ORDER BY title
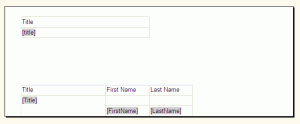
After adding another Table, this time having to choose the Dataset in the Properties, my Design window looks like this:
Create Anchors
This is all very well, but now we need to do the clever bit: we need to create links in the top table that link to results in the bottom table.
SQL Reporting Services supports the concept of bookmarks. Similar to HTML anchor tags, you can specify parts of the report to be a bookmark, and then link to them from other parts.
First, let’s add some bookmarks to our data. We’ll add the bookmark to the Title text box, so that when we link to it, we can jump straight to that Title and see the people who have that title.
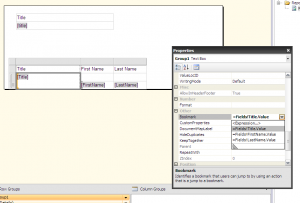
Click the Title box to view the Properties in the Properties window. (if you can’t see the Properties window press Alt+Enter.) Scroll down until you see the Bookmark entry. One of the most powerful feautures of Reporting Services is that nearly all the properties can be represented with an expression. You can change font, background colour, size, visibility – all based on expressions, and therefore data.
Choose the [Title] field from the drop down box:
This means that each title that’s shown will also have a bookmark, with the name of the bookmark being the title. Unique, easily refrerenced bookmarks!
[as an aside, although Title works in this contrived demo, in the real world you’d want to use some sort of ID to group by, and therefore bookmark by.]
Create Links
Finally, we need to alter our top table to link to these bookmarks and make it a true Table of Contents.
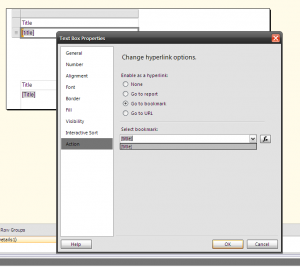
Right click the title field in the top table, but this time choose Text Box Properties. This brings up the Properties dialog box. Under the Action section, select ‘Go to bookmark’. Again, in the drop down you can choose any of the fields from the table. In this case, we only have one – the [title] field.
This will add the bookmark, but it won’t alter the formatting to make it obvious. I prefer to alter the text to be blue and underlined as most people understand this to be a clickable hyperlink.
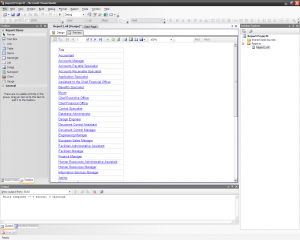
Now, if we Preview we get a true Table of Contents, with clickable links:
Clicking any of the title links will jump straight to the relavent bookmark in the second table, acting just like a Index or Table of Contents.
You can tidy this up to make it more presentable. If you examine the properties of the TOC Table you can see that you can choose to force a page break after it – which can be handy in seperating the Index from the rest of the report.






I’m thinking of doing the same, also with document map.
What’s the difference between doing this and simply adding a document map?
I think the only difference was that when I wrote this, I wasn’t aware of the document map! A document map will arguably render better into different formats than this will.
Good article but is there any way to achieve table of content with page numbers?
Dear sir,
Just a quick question , I have a requirement of creating a Table of content for my report (SSRS) with either hyperlinks navigating to specific part or having pageno in TOC, this has to work after exporting to pdf too.
The TOC works in report viewer but when exporting to pdf not .
Any help would be appreciated
Thanks & Regards
Better – User the Document Map property of table/ controls which will work in PDF export as well.
I have used the same and its working fine.