SQL Server Deadlocks: Identifying the easy way
I like when I find out something new, especially when it’s been under my nose for years and I never realised it. Sometimes I get scared about how little I know, in the grand scheme of all the things there are to know, but that usually spurs me on to continue reading, and learning.
Here’s a good example. I’m not a DBA but I’d say that I have a pretty good working knowledge of SQL. I think you need to if you develop data-bound applications. And, right now, we have a deadlock problem. Something, somewhere, is bumping heads with a new piece of code we’ve written. I wouldn’t mind, but our code is being chosen as the deadlock victim, so it looks like we’ve got it wrong.
So, how do work out what to do. Of course – to the Profiler!
The SQL Profiler is really useful, and I’ve used it for all sorts of things in the past: diagnosing integration issues, improving performance, even disassembling what 3rd party apps are doing behind the scenes. The only problem I have with it is that it chucks out a lot of data, if you don’t really know what you’re looking for. In our particular instance, that’s a Bad Thing. I’ve already found out the hard way that trying to run a Tuning trace for the Database Engine Tuning Advisor is just asking too much of the server at the moment. It shouldn’t be, but there we are.
So, not really knowing what to look for (apart from a Deadlock, somehow) and knowing that if I wanted to use the Profiler I’d have to be careful, I went searching for something to read. I found this: How to Track Down Deadlocks Using Sql Server 2005 Profiler. This is a really well-written, clear guide to using the Profiler to find locks. For instance, I’m only looking for 3 very specific types of messages to do with deadlocks at the moment, which means I can leave the trace on all day without it causing any performance issues.
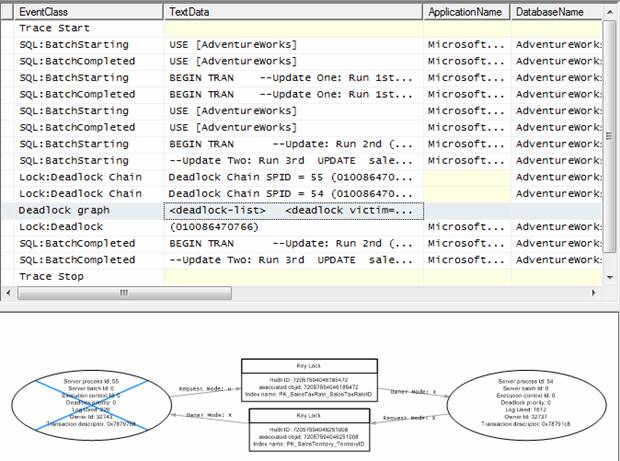
Even better, when I eventually find them, the Profiler will tell me exactly what T-SQL was run, who was victim, who was succesful, and why. Graphically! I didn’t even know the Profiler did graphics!
The oval on the left (with the cross) is the victim, the one on the right was the SQL that ran. If you hover over the ovals you get the actual SQL commands issued. The resources are shown in the middle.
If you’re having deadlock issues and don’t know where to start, I highly recommend you go and read the article. Even if you don’t think you are having deadlock issues, it might be worth setting up a trace to look for them, just to make sure.


Hi Tom,
Great article! While I have been working with SQL for a while now, I’m also not a DBA either so I feel your pain. I found SQL Profiler to be a useful tool but I’d like to mention another one I use for resolving deadlocks. You may want to check out SQL Deadlock Detector. No extra bells and whistles, but it gets the job done. Highly recommended!
Cheers,
L